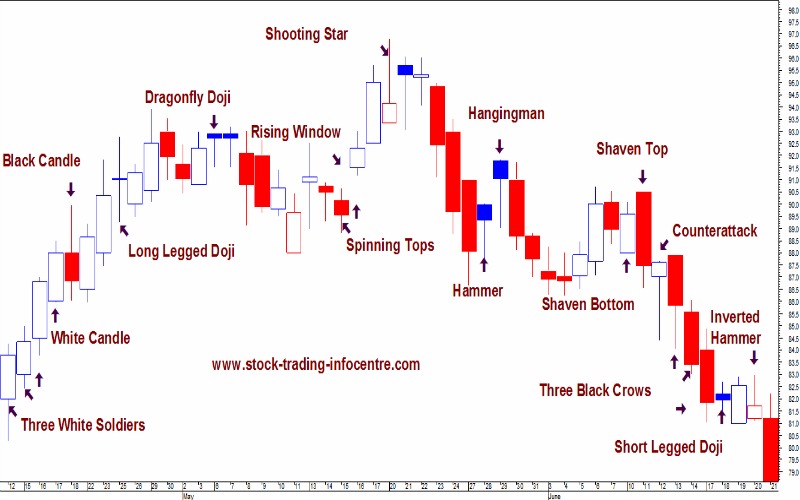
Candle stick patterns have a very important role in the technical analysis of the market movements and every candle stick pattern has a story to tell about the future market movements.
Bulls Versus Bears
A candlestick depicts the battle between Bulls (buyers) and Bears (sellers) over a given period of time. An analogy to this battle can be made between two football teams, which we can also call the Bulls and the Bears. The bottom (intra-session low) of the candlestick represents a touchdown for the Bears and the top (intra-session high) a touchdown for the Bulls. The closer the close is to the high, the closer the Bulls are to a touchdown. The closer the close is to the low, the closer the Bears are to a touchdown.
Construction of Candle Stick Patterns
Candlestick patterns are made up of one or more candlesticks and these can also be blended together to form one candlestick. This blended candlestick captures the essence of the pattern and can be formed using the following:
- The open of first candlestick
- The close of the last candlestick
- The high and low of the pattern
Types of candle stick patterns
There are more than 30 types of CSP’s, which I have analyzed and used very successfully in the correct interpretation of the market movements with the combination of few other technical indicators on different time frames to catch the successful trades.
There are Confirmed Bullish Reversal Candle Stick Patterns, Bullish Reversal Candle Stick Patterns Continuous or Support Bullish Candle Stick Patterns, Confirmed Bearish Reversal Candle Stick Patterns, Bearish Reversal Candle Stick Patterns Continuous or Support Bearish Candle Stick Patterns
CANDLE STICKS BULLISH REVERSAL PATTERNS
There are dozens of bullish reversal candlestick patterns. Below are some of the key bullish reversal patterns with the number of candlesticks required in parentheses.
- Bullish Engulfing (2)
- Piercing Pattern (2)
- Bullish Harami (2)
- Hammer (1)
- Inverted Hammer (1)
- Morning Star (3)
- Bullish Abandoned Baby (3)
CANDLE STICKS SUPPORT PATTERNS
Single candlesticks and candlestick patterns can be used to confirm or mark support levels. Such a support level could be new after an extended decline or confirm a previous support level within a trading range. In a trading range, candlesticks can help choose entry points for buying near support and selling near resistance.
CANDLE STICKS BEARISH REVERSAL PATTERNS
There are dozens of bearish reversal patterns. Below are some of the key bearish reversal patterns, with the number of candlesticks required in parentheses.
- Bearish Abandoned Baby (3)
- Engulfing, Bearish (2)
- Harami, Bearish (2)
- Dark Cloud Cover (2)
- Evening Star (3)
- Shooting Star (1)
CANDLE STICKS RESISTANCE PATTERNS
Single candlesticks and candlestick patterns can be used to confirm or mark resistance levels. Such a resistance level could be new after an extended advance, or an existing resistance level confirmed within a trading range. In a trading range, candlesticks can help identify entry points to sell near resistance or buy near support.
Other Technical Analysis
Candlesticks provide an excellent means to identify short-term reversals, but should not be used alone. Other aspects of technical analysis can and should be incorporated to increase reversal robustness. It’s important to know as to how traditional technical analysis might be combined with candlestick analysis.
To know more details about candle stick patterns and to experience the JOY of trading with such patterns, log on to https://www.tradingstation.in and register for seminar / webinar.


